How Systrace helped me to improve my code performance
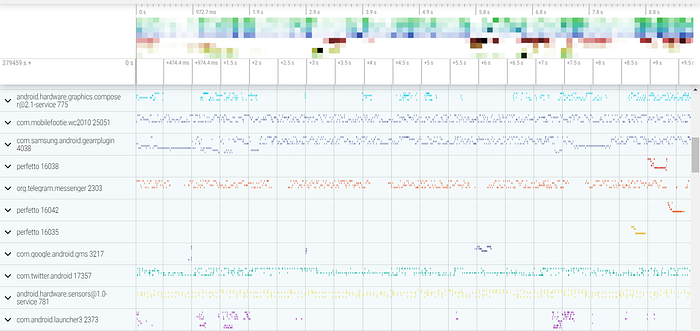
I developed a complex feature for a project last month. You can imagine this feature as two separated modules. The first module does some heavy calculation. The second module shows the result of the first module in a ViewPager and multiple RecyclerViews. When I developed it for beta release, although I applied the best practices, I didn’t care so much about performance and my goal was to make it work without bugs. Yesterday I tried to improve my code. I was sure without any doubt that some parts of my calculation code can be optimized, e.g. I used multiple For loops for some calculations and they could be replaced with one For loop, etc. So I decided to start from the first module.
But before I started, I thought it was better to measure the calculation time of the first module, so that I could know if my optimization tricks worked or not. I preferred to use the Systrace tool as profiler to collect information about my code execution.
If you know what Systrace is, skip the next section.
Systrace! What is it?
Systrace is a tool to record device activity over a short period of time, known as system tracing. It allows you to collect and inspect timing information across all processes running on your device at the system level.
You can generate Systrace report from command line with systrace command or using the System Tracing system app. To use the System Tracing system app, you need a device or an emulator with Android 9 or higher. But I recommend using Android 10 or higher because System Tracing system app generates a report with the .perfetto-trace filename extension and can be opened in the Perfetto UI.
It’s simple to record trace with Systrace on Android 10 or higher. For quick access to “Record trace” button, you should enable “Show quick setting tile”. Complete following steps:
1- Enable developer options, if you haven’t done so already.
2- Open the Developer Options settings screen.
3- In the Debugging section, select System Tracing.
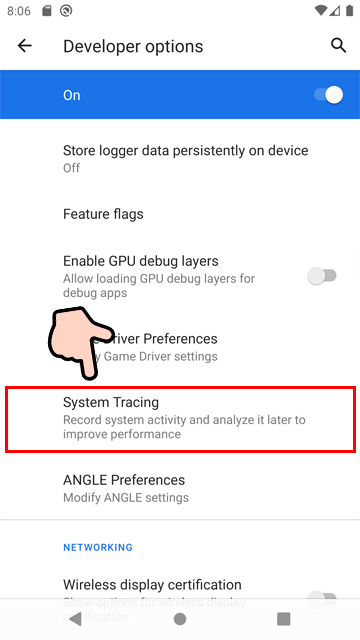
4- enable Show Quick Settings tile, as shown below.
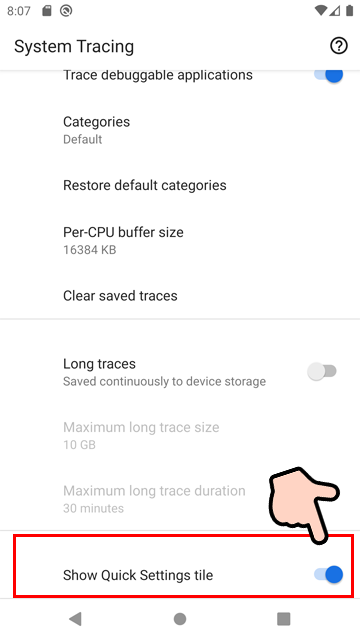
5- Now you can see record trace tile in Quick Settings. When you tap the tile (left image), Systrace starts to record trace (center image), then go to your app’s screens where want to collect their execution data. After you stop trace recording, “Trace saved” notification will be shown. You can share the report by clicking on the notification.


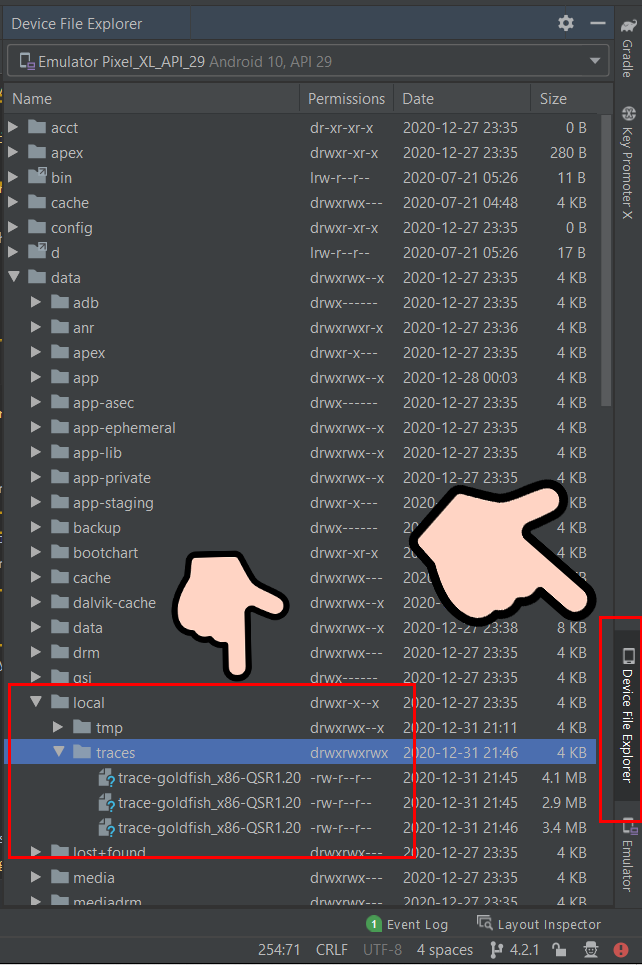
Or you can download it from “/data/local/traces” path with “Device File explorer” on Android Studio. Like below:
6- To see reports, Perfetto UI is perfect! It’s convenient and has a simple UI.

Find culprits
As I said, I decided to use the Systrace tool. So I wrapped the first module’s code between Trace.beginSection(“Create XXX”) and Trace.endSection() methods (with these methods, we can use to label a particular section of code). Then I recorded the trace and opened the report on Perfetto.
I found my custom event by searching “Create XXX” in the top search box. To my surprise, the second module’s execution took longer than the first one (As seen below)! So I changed my decision and started my investigation from the second module.

The first things that attracted my attention were a lot of columns in the second module’s portion.

I zoomed in on one column and saw it was related to the inflating view of RecyclerView’s ViewHolder. As you see, each column was related to a “RV CreateView” event and multiple inflation happened.

This was a clue for me that view hierarchy inflation spent a lot of time in the second module! And I should improve it. I selected a portion of the timeline (the second module’s part) to inspect more details to get more information.

The report showed the inflation process spent 452ms! This time was 98% of the second module’s time(460ms).
I decided to create all views programmatically in the second module. Also, I flattened my layout view hierarchy and replaced unnecessarily heavy layout with a simple one where possible e.g. Framelayout
Again I recorded a trace. We should measure before and after we’ve applied the optimization. The new report showed that optimization was very helpful! The time of inflation events decreased a lot! From 452ms to 11ms (41x faster).

I tried to find another culprit, so I zoomed in on the second module’s portion again. It seemed OnBind method was being executed slowly.

I knew that I didn’t write any complex or heavy code on OnBind method of RecyclerView. I just called some methods from old classes. I should mention the project was big and I didn’t know about implementation detail of some classes and only used them.
I created some custom events with Trace.beginSection and Trace.endSection and tried to figure out which part of old classes was executed slowly. Below, you can see one of my custom events. The report shows xxxxInitialize method of an object was another culprit.

I checked the xxxxInitialize method’s implementation, subscribeXXXXInfoListener method was called there. The object subscribed itself to get data from multiple sources when new data was available by calling this method. This subscription process is slow because some validation and calculations should be done before it. I knew that we didn’t use the data that was coming from the listener. So I created a new class for my feature without extra code and used it instead of the old class. Then I re-recorded the trace (Don’t forget this step, It’s crucial to measure your code performance to see your optimization is good or not!).
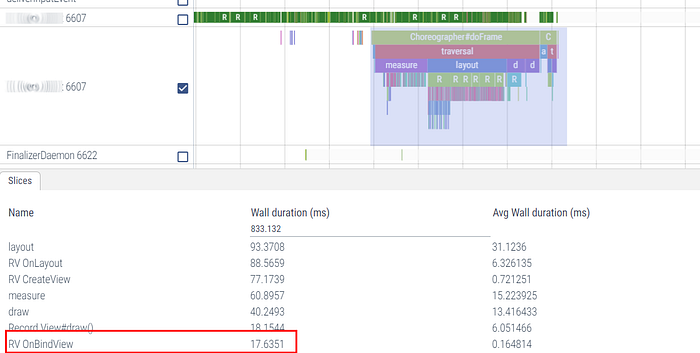
The new report showed “RV OnBindView” event time decreased from 28ms to 17ms with a simple change.
Conclusion
In total, I could speed up my feature ~50% and the whole process time decreased from 690ms to 350ms. I wanted to start refactoring from my calculation code, but now, I’ve speeded up my code a lot without any changes in that part. Now the feature is ready to be released in production.
In the end, I want to tell a quote from Martin Fowler.
If you make an optimization and don’t measure to confirm the performance increase, all you know for certain is that you’ve made your code harder to read.
I hope you enjoyed this article. Feel free to contact me at abbas.oveissi@gmail.com, on Twitter (aov_1991) or Github (https://github.com/abbas-oveissi)
